2020 Developer ToolsApp Store, Distribution & Marketing
WWDC20 · 15 min · Developer Tools / App Store, Distribution & Marketing
Identify trends with the Power and Performance API
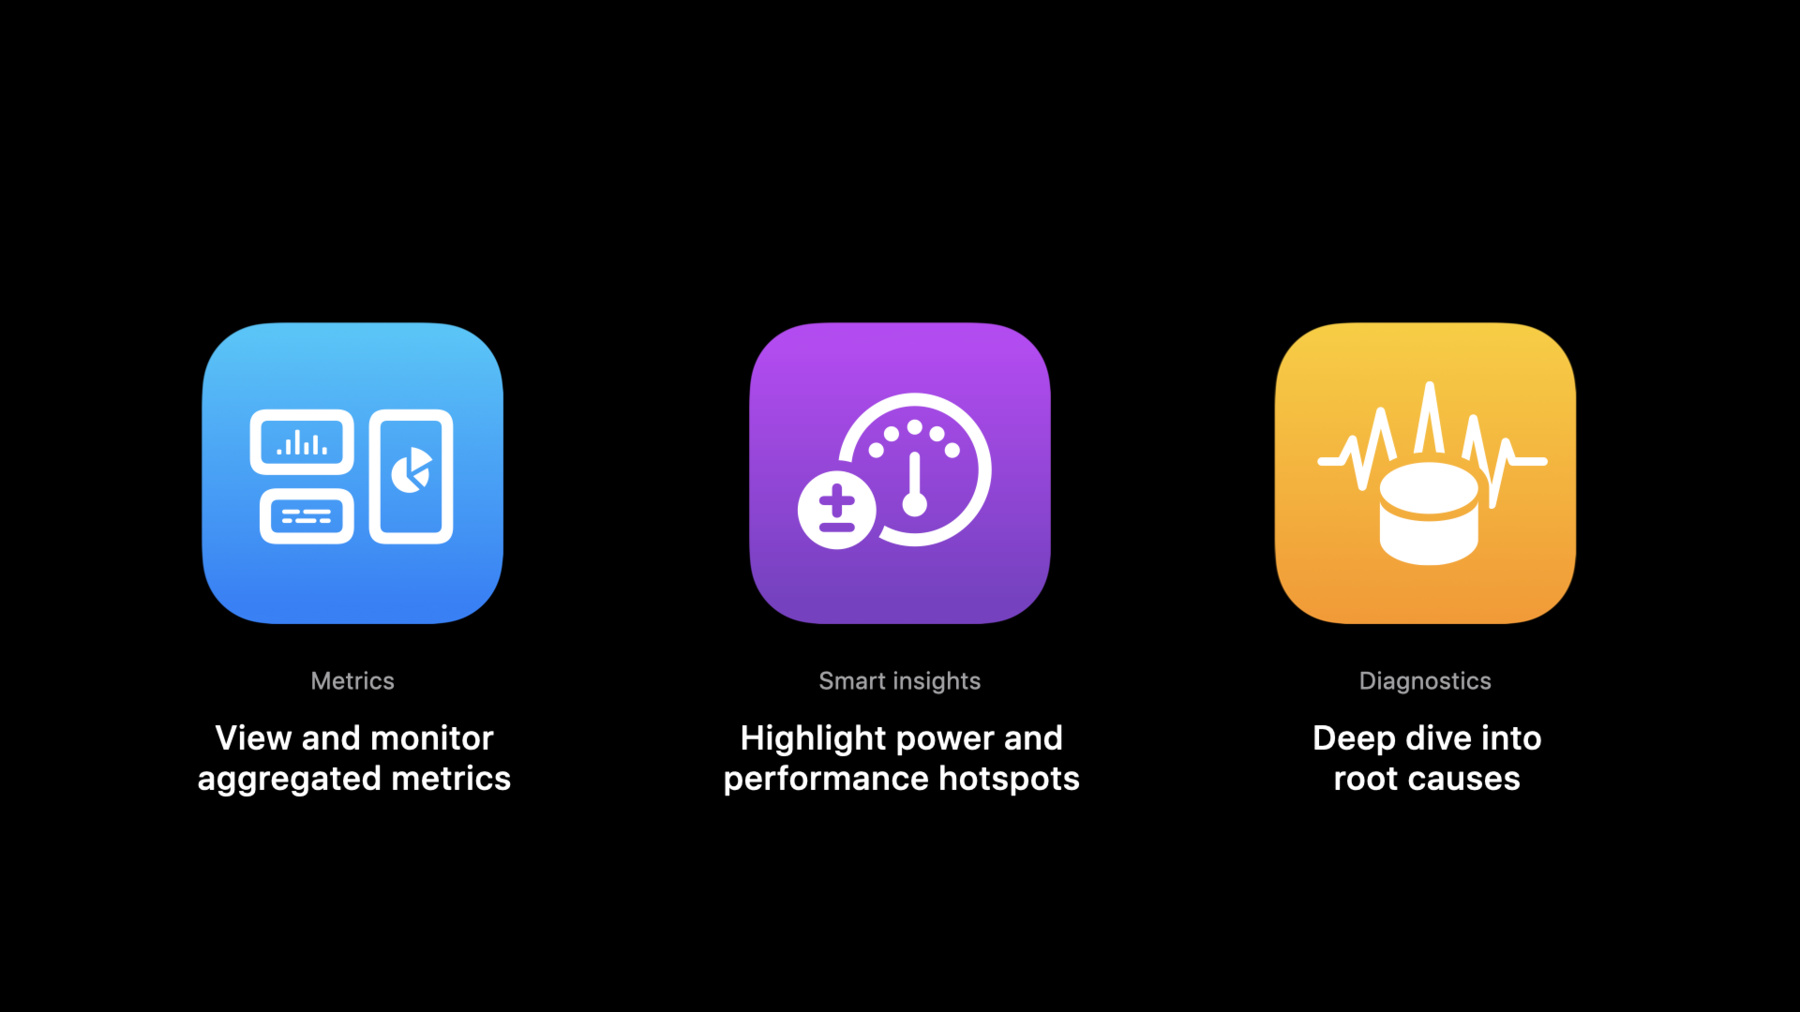
Track your app’s performance metrics in custom team dashboards, bug reporting systems, and other custom workflows with the Power and Performance Metrics and Diagnostics API. Explore how you can access the same data that drives the Power and Performance analysis tools in Xcode to quickly identify trends and regressions. Learn how to leverage diagnostic signatures and logs — including call stack trees — to prioritize and debug issues. And discover how you can integrate this API with your development team’s existing tools to troubleshoot issues quickly, offering better overall performance for people who use your app.
Watch at developer.apple.com ↗Code shown on screen · 5 snippets
Get metrics and insights for most recent app versions
GET /v1/apps/{id}/perfPowerMetricsGet top diagnostic signatures for released app versions
GET /v1/builds/{id}/diagnosticSignaturesGet logs for a diagnostic signature
GET /v1/diagnosticSignatures/{id}/logsAccess perfPowerMetrics for an app
curl -X GET -H "Authorization: Bearer ${JWT}" -H "Accept: application/vnd.apple.xcode-metrics+json,application/json" https://api.appstoreconnect.apple.com/v1/apps/${id}/perfPowerMetricsAccess diagnosticSignatures for an app build
curl -X GET -H "Authorization: Bearer ${JWT}" -H "Accept: application/vnd.apple.xcode-metrics+json,application/json" https://api.appstoreconnect.apple.com/v1/builds/${id}/diagnosticSignaturesRelated sessions
-
 17 min
 -
 16 min
 -
 24 min
 -
 26 min
 -
 11 min
 -
 14 min
 -
 14 min